Edgen AI operates independently of, and is not controlled by Aspen Digital Financial Limited.
Apple opens $250M Siri settlement claims worth up to $95
 Edgen Stock·Sep 21 2026, 21:28
Share to
Share to
Copy link


[1] Apple customers can now submit claims for $250M settlement in deceptive marketing suit (https://nypost.com/2026/09/21/business/apple- ...)[2] Apple $250 million Siri AI settlement claims open now (https://www.yahoo.com/news/us/articles/apple- ...)[3] Apple Siri AI Settlement Opens Claims to Eligible iPhone Owners (https://www.unite.ai/apple-siri-ai-settlement ...)[4] Apple customers face Dec. 21 deadline to claim money from $250 million Siri settlement (https://www.consumeraffairs.com/news/apple-cu ...)[5] Apple's $250M Siri settlement is taking claims now, worth up to $95 (https://finance.yahoo.com/technology/ai/artic ...)
Related News
Sep 21 2026, 22:00
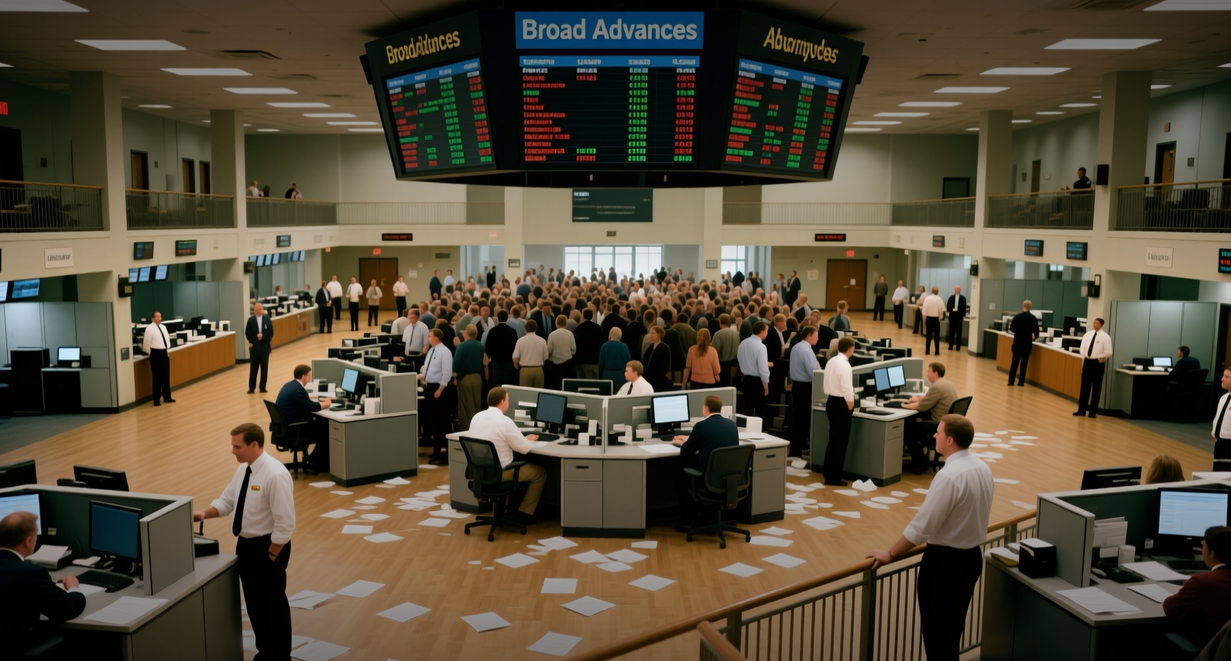
S&P 500 climbs 1.5% as 1999-style breadth warning flashes
The S&P 500 jumped 1.5% to 7,764.70 on Monday, pulling within 0.4% of its record close, even as more index members touched new 52-week lows than new 52-week highs — the first such breadth inversion since 1999. "An index at an all-time high with negative net new highs is a leadership problem, not a valuation problem," said Priya Mehta, equity market structure analyst at Edgen. "The cap-weighted number is telling you what five or six companies did. The median stock is telling you what the economy did." The divergence is stark. The S&P 500 added 114.20 points, and the Nasdaq composite climbed 2.3% to 27,122.09, its own record, as chip and artificial-intelligence names led. Advanced Micro Devices rallied 9.9% and crossed $1 trillion in market value; Nvidia added 2.3%. The Dow Jones Industrial Average, an equal-weighted price index, rose just 0.7% to 52,048.83. The Russell 2000 gained 0.5% to 2,875.36 — roughly a third of the S&P's advance. That gap between the headline and the median is the whole story. When a handful of trillion-dollar companies carry the index, the index can print a record while the typical constituent is being sold. Monday's session was the first time since 1999 that new lows outnumbered new highs on a day the S&P rose more than 1%. ## The 1999 comparison is not a forecast, but it is a warning The last time this happened, the S&P 500 was in the final stretch of the dot-com run. The index peaked in March 2000 and then fell about 49% over the following 30 months. Breadth deterioration did not cause that decline — it described the market's internal condition before it happened. The mechanics are straightforward. Cap-weighted indices give the largest companies the largest influence, so a $1 move in a $4 trillion company moves the index far more than a $1 move in a $40 billion one. When gains concentrate, the index's advance overstates how the average stock is doing. Equal-weight and small-cap segments then lag, which is exactly what Monday's numbers showed: the Dow's 0.7% and the Russell 2000's 0.5% against the S&P's 1.5%. The cross-asset backdrop explains the rally itself. Brent crude fell 3.4% to $100.34 a barrel, down from nearly $110 last week, and the 10-year Treasury yield eased to 4.95% from 5.01% late Friday after crossing above 5% for the first time since 2023. Lower oil and lower yields relieve the two pressures that had been squeezing equity multiples. Indexes rose 0.9% in France, 1.2% in Hong Kong and 1.6% in South Korea on the same relief. Morgan Stanley's Michael Wilson said another leg higher in oil, gasoline and refined product prices is the main near-term risk that could keep the market from reaching his year-end target. The national average for regular gasoline has already climbed to nearly $4.48 a gallon, according to AAA, from less than $4.32 a week earlier and $3.18 a year ago. ## What the median stock is saying Breadth is a measure of participation, and participation is what makes an advance durable. A rally carried by a narrow group is more sensitive to any single leader's disappointment: if the AI trade stumbles, there is no broad base of advancing stocks to absorb the shock. That is the risk the 52-week lows are flagging. The counterargument is that narrow leadership has persisted for long stretches without immediate consequence. The S&P 500 is up 13.4% year to date, the Nasdaq 16.7%, and the Russell 2000 15.9% — small caps are not being abandoned outright, they are simply not keeping pace with the largest names. Bitcoin's move back above $86,000 lifted crypto-linked equities, with Coinbase Global up 3.5% and Robinhood Markets up 2.9%, another sign that risk appetite is intact rather than retreating. What matters next is whether the breadth reading persists. A single session of more new lows than highs can be noise; a cluster of them while the index sits at a record is a pattern. Traders will watch the 10-year yield's hold below 5%, Brent's path around $100, and whether the equal-weighted S&P 500 can close the gap with its cap-weighted sibling. The next test comes with the September employment report and the Federal Reserve's October meeting, both of which will reset the rate expectations that have been driving the largest stocks. For now, the index and its members are telling different stories. The index says record. The median stock says caution. This article is for informational purposes only and does not constitute investment advice.

Sep 21 2026, 21:55
Congress moves to slow US-China investment after deal surge
A bipartisan group of lawmakers is drafting legislation that would force U.S. investors to clear Chinese equity stakes with the Treasury Department before closing, extending Washington's screening reach from inbound deals to the roughly $1.2 trillion of American capital already committed to Chinese assets. "The bill is designed to close the gap between what we screen on the way in and what we let walk out the door," said a senior Senate aide involved in drafting the measure, who asked not to be named because the text is not yet public. The legislation would require U.S. persons to notify Treasury before acquiring equity in Chinese companies working in semiconductors, artificial intelligence, quantum computing, hypersonics and advanced aerospace, with a 45-day review window and civil penalties of up to $1 million or twice the transaction value for failures to file. Treasury's outbound screening program, in force since January 2025, already covers those five sectors, but the bill would convert its notification regime into a mandatory filing requirement with a statutory deadline. The House Financial Services Committee has scheduled a markup for the week of Oct. 6, and the Senate Banking Committee is drafting a companion text. The measure lands on a bilateral investment relationship that has been rebuilding since 2023. U.S. direct investment in China stood at $126.9 billion at the end of 2024, according to Bureau of Economic Analysis data, while U.S. holdings of Chinese portfolio assets — equities and debt — totaled about $1.1 trillion, the Treasury's latest international capital survey shows. Chinese direct investment in the U.S. was $28.4 billion over the same period. The flow has been one-directional and concentrated: venture and growth capital into Chinese AI and semiconductor startups accounted for the largest share of the increase, according to PitchBook data, with U.S. funds participating in a majority of the largest China-based rounds above $100 million. The transmission into public markets is already visible. The Nasdaq Golden Dragon China Index has fallen 6.8% since the start of September, underperforming the S&P 500 by roughly 9 percentage points, and the iShares MSCI China ETF has recorded three consecutive weeks of net outflows, according to fund flow data compiled by Bloomberg. Shares of U.S. asset managers with the largest China-dedicated vehicles have moved with the headlines rather than with earnings. The last time Congress advanced comparable outbound restrictions, in the summer of 2024, the Golden Dragon index fell 11% over the six weeks that followed before recovering half the decline once the final text narrowed the covered sectors. Beijing has signaled it will respond in kind. China's Ministry of Commerce said in a Sept. 18 statement that it "reserves the right to take necessary countermeasures" against measures it deems discriminatory, without specifying targets. The 2023 Chinese restrictions on gallium and germanium exports, imposed after U.S. chip controls, cut global supply of the two metals by 12% within two quarters and pushed gallium prices up 43%, according to Fastmarkets data — a template for how quickly a tit-for-tat response can move physical markets. The stakes are largest for the venture and private equity firms that built China-focused franchises over the past decade. A mandatory filing regime adds legal cost and delay to every deal, and a 45-day review window can kill a competitive auction outright. For limited partners, the risk is not a ban but a slow bleed: funds that cannot deploy committed capital face extension requests and discounted secondary sales, and China-dedicated vehicles are already trading at 15% to 25% discounts to net asset value on the secondary market, according to advisory firm data. The next hard date is the House Financial Services markup in the week of Oct. 6. If the bill clears committee with the five-sector scope intact, expect the compliance burden to fall first on funds with more than $1 billion in China exposure, with the filing requirement taking effect for transactions closing after Jan. 1, 2027. If the covered sectors narrow to semiconductors and AI alone, the near-term hit to deal flow is smaller but the precedent — that Washington will legislate the outbound side of the relationship — stands regardless. This article is for informational purposes only and does not constitute investment advice.

Sep 21 2026, 21:33
Silver vaults shed 7.2 million ounces as COMEX deliveries spike
Silver held in COMEX depositories dropped by 223 tonnes last week, a 2.1% cut to exchange stock, while delivery notices on September futures ran to 6,168 contracts. The withdrawal was concentrated in eligible metal, which fell 8.6 million ounces to 232.8 million ounces, according to CME vault data. Registered silver — the only category that can settle a futures contract — rose 1.4 million ounces to 97.3 million ounces over the same period. "Registered stocks are still sufficient to meet delivery obligations," said Mike Maharrey, analyst at Money Metals Exchange. "The squeeze case depends on whether this pace of withdrawal persists and starts pulling metal out of the registered category." The distinction matters for anyone pricing front-month risk. A drain that hits eligible metal signals holders moving bullion out of the futures settlement system; a drain that hits registered metal directly reduces the pool available to deliver against open short positions. Last week's data show the first, not the second. ## 30.84 million ounces converted from paper CME recorded 6,168 September silver delivery notices through Sept. 18, representing 30.84 million ounces of metal moving from futures positions into physical hands. That is the mechanical link between the vault numbers and the delivery surge: each notice converts a paper claim into a demand for bullion. The weekly drawdown was roughly 25% larger than the outflow recorded during the October 2025 squeeze, when front-month spreads blew out and lease rates spiked. The difference this time is that deliverable supply expanded rather than contracted, which is why spot silver has not broken into backwardation. Spot silver traded at $65.93 an ounce at 16:50 UTC on Sept. 21, down 0.46% on the session, according to XAGUSD quotes. The iShares Silver Trust (SLV) closed at $59.63, down 0.50%, with $32.81 billion in assets. Sprott Physical Silver Trust (PSLV) traded at $21.56, down 0.69%, and the Aberdeen Physical Silver Shares ETF (SIVR) at $62.74, down 0.43%. ## What 97.3 million ounces buys Registered inventory of 97.3 million ounces covers roughly three times the 30.84 million ounces of September deliveries recorded so far, leaving a buffer that would take several weeks of comparable withdrawals to exhaust. That is the arithmetic standing between the current drain and a repeat of October 2025. The forward signal is the next weekly CME vault report, due Sept. 24. A second consecutive drawdown of similar size — particularly one that pulls from registered rather than eligible stock — would narrow the deliverable cushion and give short holders reason to source metal ahead of the December contract roll. Gold offers the peer anchor. COMEX gold vaults have held broadly steady through September, with the metal trading near record levels on central bank buying rather than exchange-level tightness. Silver's move is a physical-market story specific to the white metal, not a broad precious-metals vault drain. This article is for informational purposes only and does not constitute investment advice.