Edgen AI operates independently of, and is not controlled by Aspen Digital Financial Limited.
Hong Kong semiconductor stocks jump 8% as AI rebound takes hold
 Edgen Stock·Jun 29 2026, 07:55
Share to
Share to
Copy link



[1] Hong Kong semiconductor sector strengthens in afternoon trading; GigaDevice up over 14%, Hua Hong Semiconductor up over 8%, SMIC up over 5% (https://wallstreetcn.com/livenews/3125917 ...)[2] Asia stocks mixed as AI valuation worries overshadow easing US-Iran tensions By... (https://au.investing.com/news/stock-market-ne ...)[3] South Korea's Kospi jumps as SK Hynix stock surges on blockbuster Nasdaq listing... (https://finance.yahoo.com/markets/stocks/arti ...)[4] Tech stocks are plunging as global investors dump high-flying chip makers (https://www.businessinsider.com/south-korea-k ...)[5] Baidu shares jump 7% as AI chip arm Kunlunxin said to target $50 billion Hong... (https://www.cnbc.com/2026/06/29/baidu-kunlunx ...)
Related News

Jul 17 2026, 07:54
BofA warns gold could fall to $3,315 as downtrend deepens
Gold fell to $4,010.39 per troy ounce on COMEX, down 1.23% in the past 24 hours, as Bank of America issued a bearish forecast targeting $3,315. "The downswing in gold prices is far from over, and the correction seen so far this year may still have substantial downside," Bank of America technical strategists said in a note dated July 16. They warned the trend could resemble the devastating bear markets that followed major gold rallies in 1980 and 2011. The strategists noted that each of the three major gold bear markets since 1970 saw corrections of at least 50% of the preceding rally. If the same pattern repeats, downside risks could point to $3,315 per ounce, implying roughly 16.7% downside from current spot prices. The bank recommended a phased buying strategy, advising investors to complete full allocation only when gold falls into the $3,450-$3,250 range. Gold has accumulated a decline of more than 3% this week, on track for the biggest weekly drop in six weeks. The 52-week intraday high stands at $5,597.23, set Jan. 29, while the 52-week low is $3,283.00. The next catalyst for gold prices will be the Federal Reserve's July 29-30 policy meeting, where rate expectations could determine whether the metal finds support or extends losses. ## Gold's 121% Rally Faces Historical Precedent Over the past five years, gold has appreciated 121.28%, compared with the S&P 500's 73.62% return over the same period, according to TwelveData. The metal crossed the $3,000 threshold in March 2025 and peaked at $5,597.23 on Jan. 29, 2026 — a record high. Since then, it has retreated 28.3% from that peak, placing the current drawdown within striking distance of the 50% correction threshold that BofA's historical analysis flags as typical for gold bear markets. Gold is down 7.41% from one month ago and has posted a six-month return of negative 12.64%, according to COMEX data. The year-to-date decline stands at 7.06%. ## Phased Buying Strategy at $3,450-$3,250 BofA's strategists proposed a phased buying strategy, recommending investors complete full allocation only when gold prices fall into the $3,450-$3,250 range. The $3,315 target sits near the midpoint of that zone. For context, gold at $3,315 would represent a 40.8% decline from the January 2026 all-time high of $5,597.23 — still short of the 50% corrections seen in 1980 and 2011 but approaching that threshold. The bearish call from one of Wall Street's largest banks could accelerate institutional rebalancing away from gold, particularly if the metal breaches the $3,450 support level. Gold mining stocks, which typically amplify moves in the underlying metal, face additional pressure if the downtrend continues toward BofA's target. This article is for informational purposes only and does not constitute investment advice.

Jul 17 2026, 07:53
JPMorgan says US stocks face 3 more months of deleveraging
**A normalization phase in investor leverage that began in June will continue to act as a tactical headwind for equities through at least October, according to JPMorgan.** US equities face at least three more months of deleveraging pressure across leveraged ETFs, options and margin accounts, JPMorgan said, extending a process that began in June. "The deleveraging process may dominate the market over the coming months, causing significant price volatility," Nikolaos Panigirtzoglou, managing director of global market strategy at JPMorgan, said in the bank's Flows & Liquidity report published July 15. Leveraged ETF assets have shrunk 13% from their peak, with semiconductor-focused funds contracting 34%, the report shows. The retail bullish call buying indicator hit 14 million contracts on June 5, matching historical highs from October 2025 and November 2021 — levels that preceded multi-month tech corrections each time. The NYSE Net Debit Balance, a proxy for retail margin leverage, remains at extremes comparable to late 2021 and mid-2018 peaks. The supply-demand backdrop provides a longer-term cushion — JPMorgan estimates net equity demand of about $197 billion in the second half, supported by $482 billion in projected retail inflows — but the near-term deleveraging dynamic is expected to dominate, keeping markets range-bound through October. **Leveraged ETFs Face a Structural Drag** The mechanical decay embedded in leveraged ETFs means range-bound trading erodes their size automatically. If an underlying index falls 10% one day and rebounds 11.1% the next, a 3x leveraged fund loses 30% then gains 33.3% — a net loss of 7%. This built-in decay has reduced total leveraged ETF assets by 13% from their peak, but the ratio of leveraged ETF size to underlying market capitalization remains elevated relative to history. JPMorgan estimates it will take approximately three more months of range-bound trading for that ratio to return to pre-April levels. New capital continued flowing into leveraged ETFs in July, extending the timeline. The problem is not confined to any single sector — the ratio for all leveraged stock ETFs is high relative to its own history, indicating a systematic risk across the entire market. **Options and Margin Accounts Still Elevated** The retail bullish call buying indicator tracked by JPMorgan has fallen from its June 5 peak of 14 million contracts, but the bank said it needs to drop to between 2 million and 4 million — a "capitulation" level — before tech stocks can stabilize. Historical patterns show each prior peak triggered multi-month adjustments. Margin debt presents a similar challenge. The NYSE Net Debit Balance is at levels that preceded extended market corrections in late 2021 and mid-2018. While the metric has shown early signs of decline, JPMorgan said "a significant amount of deleveraging is still needed before they cease to be a major drag on the stock market." Hedge funds, by contrast, have largely normalized. Equity long/short funds posted positive returns in June despite the broader market decline, aided by semiconductor strength. But their correlation with chip stocks has declined in July, and high-frequency leverage indicators suggest reduced exposure to the sector. JPMorgan's full-year net equity demand estimate of about $275 billion — with roughly $197 billion concentrated in the second half — provides a structural backstop, but the bank said the deleveraging process will likely dominate price action in the near term. This article is for informational purposes only and does not constitute investment advice.
Jul 17 2026, 07:31
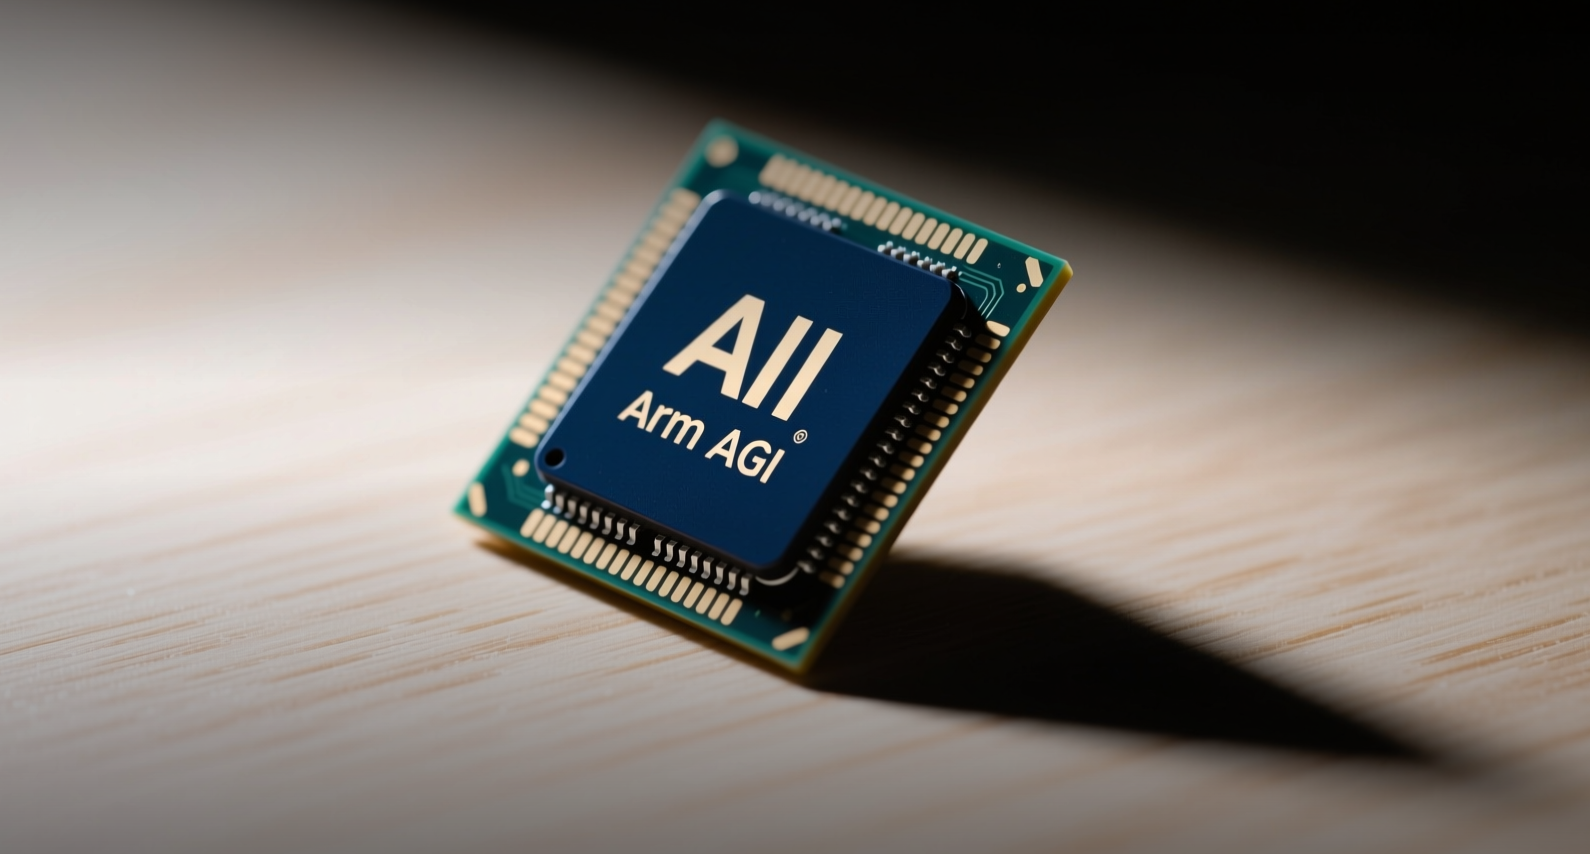
Arm CEO says AI boom faces 2-3 year supply bottleneck
The artificial intelligence boom is being held back by what the industry cannot build rather than what customers will not buy, with supply constraints on chips, data centers, energy and workers expected to persist for two to three years. "Demand for AI infrastructure remains strong, with chips, data centers, energy and workers all limiting supply," Rene Haas, chief executive of Arm Holdings, told CNBC's Morgan Brennan in an exclusive interview at the Pennsylvania Defense and Innovation Summit on Wednesday. The chip designer has doubled its demand outlook for its AGI CPU to $2 billion across fiscal 2027 and 2028, with Haas projecting the product could generate $15 billion in annual revenue within about five years. Arm is working with Taiwan Semiconductor Manufacturing Co., Socionext, and customers including Oracle Corp. and Microsoft Corp. to secure wafer, packaging and memory supplies for the chip. Arm's data center business is poised to become its largest segment "very soon," Haas said. The bottleneck threatens to slow the pace of AI deployment at a time when companies are racing to build out inference and training infrastructure. If supply constraints persist as Haas projects, it could push up costs for hyperscalers and delay the monetization timeline for the billions of dollars already committed to AI capital expenditure. **Supply Chain Squeeze Hits Every Layer** The constraints span the full stack of AI infrastructure. On the chip side, advanced packaging capacity at TSMC — particularly its CoWoS (chip-on-wafer-on-substrate) technology, which stacks memory and logic dies together — remains a bottleneck despite the foundry's aggressive expansion. Beyond silicon, data center construction faces transformer lead times stretching 12 to 18 months, while grid interconnection queues in the US and Europe can take four to seven years for new high-voltage connections. Energy availability has emerged as a binding constraint in regions with aggressive AI buildout plans. Northern Virginia, the world's largest data center market, has seen utilities pause new connections because of grid capacity limits. Haas's two-to-three-year timeline aligns with projections from grid operators and independent power producers, who estimate new gas-fired and renewable capacity will take until 2028 to 2029 to come online at scale. The labor shortage compounds the problem. Semiconductor engineers, data center technicians and power systems specialists are in short supply globally, with the Semiconductor Industry Association projecting a shortfall of 67,000 workers in the US alone by 2030. **Geopolitical Crosscurrents Add Uncertainty** Haas also told Reuters on June 2 that the US would struggle to ban exports of AI-capable CPUs to China because the chips serve a broad range of computing workloads and lack the clear performance thresholds used to regulate AI GPUs. "They would have to limit everything," Haas said, noting that CPUs are harder to restrict than dedicated AI accelerators. The comments come as both the Biden and Trump administrations tightened export controls on advanced semiconductors, though those rules have focused primarily on GPU-class chips from Nvidia Corp. and Advanced Micro Devices Inc. ByteDance and Oracle have already started using Arm's AGI CPU for AI inference workloads, Haas said, showing the chip is gaining traction in both Chinese and US markets despite trade tensions. **What This Means for Investors** Arm's stock, which has more than doubled since its September 2023 IPO, trades at elevated multiples reflecting the AI premium baked into semiconductor names. The supply constraint narrative cuts both ways: it validates the structural demand thesis that underpins Arm's long-term revenue targets, but it also introduces execution risk if capacity additions fall behind Haas's timeline. Nvidia, which relies on TSMC's CoWoS packaging for its H100 and B200 GPUs, faces similar supply headwinds, though its scale gives it priority allocation. For hyperscalers like Microsoft, Amazon and Google, the bottleneck means their massive AI capital expenditure budgets may not translate into proportional compute capacity growth over the next two to three years, potentially delaying the revenue inflection points investors are pricing in. *This article is for informational purposes only and does not constitute investment advice.*