Edgen AI operates independently of, and is not controlled by Aspen Digital Financial Limited.
Dow climbs 200 points as Chicago Fed index slips below zero
 Edgen Stock·Sep 21 2026, 15:25
Share to
Share to
Copy link

[1] Dow Surges Over 200 Points; Chicago Fed Activity Index Falls In August (https://www.benzinga.com/markets/market-summa ...)[2] Stock market today: Dow up as Alphabet shines, tech fund offers entry; oil dips on Iran hopes (live coverage) (https://www.msn.com/en-us/money/general/stock ...)[3] The New York Sun (https://www.nysun.com/ ...)[4] Chicago Fed National Activity Index suggests economic growth cooled in August (https://www.msn.com/en-us/general/general/chi ...)[5] Chicago Fed Index Shows Declining Growth in August (https://www.marketscreener.com/news/chicago-f ...)
Related News
Sep 21 2026, 16:00
Hormuz strikes hit 2 vessels as Brent holds above $105
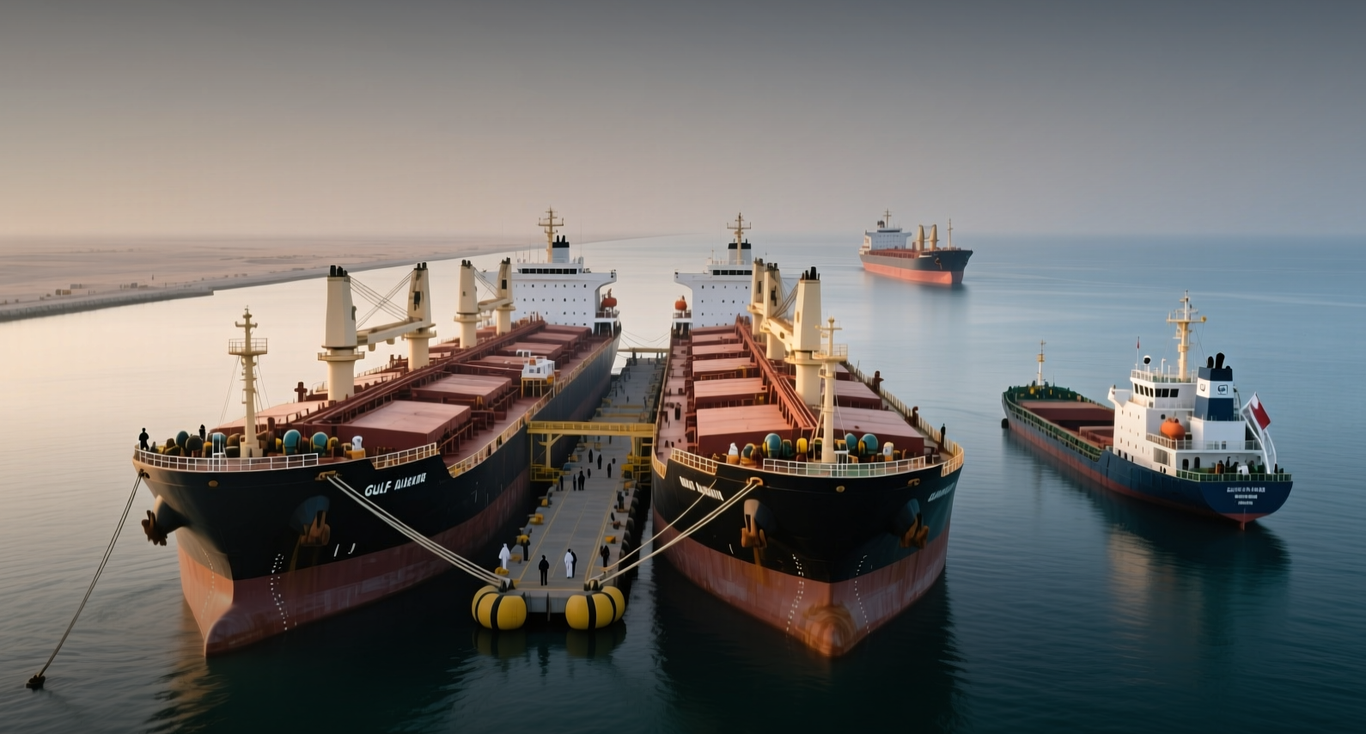
A liquefied petroleum gas carrier was struck by projectile debris while exiting the Strait of Hormuz on Monday, the second attack on a commercial vessel in the chokepoint in a single day, according to the United Kingdom Maritime Trade Operations center. The UKMTO said the LPG carrier's crew was unharmed, the vessel was continuing to its next port of call under its own power, and no environmental impact had been reported. Authorities are investigating. Earlier on Monday, the same agency reported an "unknown projectile" struck a tanker heading into the strait, injuring two crew members; that vessel also kept moving under its own power. Both incidents land on a waterway that carried roughly 20 million barrels a day in peacetime — about a fifth of global oil supply — and where traffic is already running well below normal. Iran has asserted control over much of the strait since the U.S. and Israel launched the war on Feb. 28, and the resulting blockade pushed producers into a costly workaround: ship-to-ship transfers in the Gulf of Oman, where tankers raft together to move crude onto larger vessels outside the risk zone. That patchwork is expensive. Benchmark freight rates for a very large crude carrier hauling Gulf crude to China have climbed above $30 per barrel, the highest on record, according to LSEG data. With Brent crude trading around $105, freight now accounts for more than a quarter of the delivered cost, against 2 percent to 3 percent before the war. "We are witnessing one of the biggest wealth transfers from oil producers to tanker owners," said Keshav Lokhiya, chief executive of HiLo Analytics. Exports through Hormuz reached about 6.5 million barrels a day so far in September, the highest since the brief spike after the June ceasefire, Kpler data show. Roughly 2.5 million barrels a day of that is expected to load via ship-to-ship transfers in the Gulf of Oman this month, up from 1.4 million in August — about 40 percent of current Hormuz volumes, in a method rarely used before the war. ## A $30 barrel of freight rewrites the export map The economics of the shuttle system explain why producers keep using it even as attacks continue. Abu Dhabi National Oil Company developed the approach in April, using tankers as shuttles between Gulf terminals and safer Omani waters rather than committing them to multi-week round trips to Asia. Saudi Aramco has since leaned on the same method, after Iran-backed militants in Iraq struck the kingdom's East-West pipeline on Sept. 10, cutting off roughly 4 percent of global oil supplies that had been flowing to the Red Sea port of Yanbu. Houthi forces have simultaneously tightened their grip on the Bab el-Mandeb Strait. The result is a market that is adapting rather than seizing up. UAE oil exports are set to reach 3.6 million barrels a day in September, above the 2025 average of 3.4 million. But the cost of that adaptation is being absorbed somewhere: producers are offering deeper discounts on their crude to keep it competitive, and the expanded use of tankers as shuttles has tightened global vessel availability, pushing freight rates higher across unrelated routes. The last time the strait saw a comparable multi-vessel attack sequence, in the tanker incidents of mid-2019, Brent added roughly 4 percent over the following week and war-risk premiums for Gulf transits jumped several-fold before retreating once attribution was established. Monday's strikes have not yet produced a comparable move, in part because both vessels continued under their own power and no cargo was lost. ## The unattributed projectile is the swing factor What keeps the risk premium elevated is that neither UKMTO notice named an attacker. Without attribution, insurers cannot reprice Gulf transits on a defined threat model, and shipowners cannot judge whether the corridor along Oman's coastline — where vessels increasingly sail with navigation systems switched off under U.S. naval protection — remains viable. That ambiguity cuts both ways for prices. A formal state-level response or a third strike within days would likely widen war-risk premiums again and push Brent toward the $108 level touched last week, when the Saudi pipeline attack and the Red Sea squeeze combined. A quiet stretch, by contrast, would let the premium bleed out the way it did in 2019, with freight rates staying structurally high but the headline risk bid fading. For energy importers in Asia, which absorb the bulk of Gulf barrels, the exposure is now less about the spot price of crude than about the delivered cost. A VLCC cargo of 2 million barrels at $30 per barrel of freight carries $60 million in shipping cost alone — a figure that flows straight into refinery margins in China, India and South Korea, and from there into diesel and jet fuel prices. The UKMTO has not indicated when its investigation will conclude. Traders will be watching the next 48 hours for a third incident, and the war-risk market for the first sign that underwriters are repricing the corridor. This article is for informational purposes only and does not constitute investment advice.
Sep 21 2026, 15:56
Supertanker orders hit 217 as Hormuz disruption stretches crude voyages
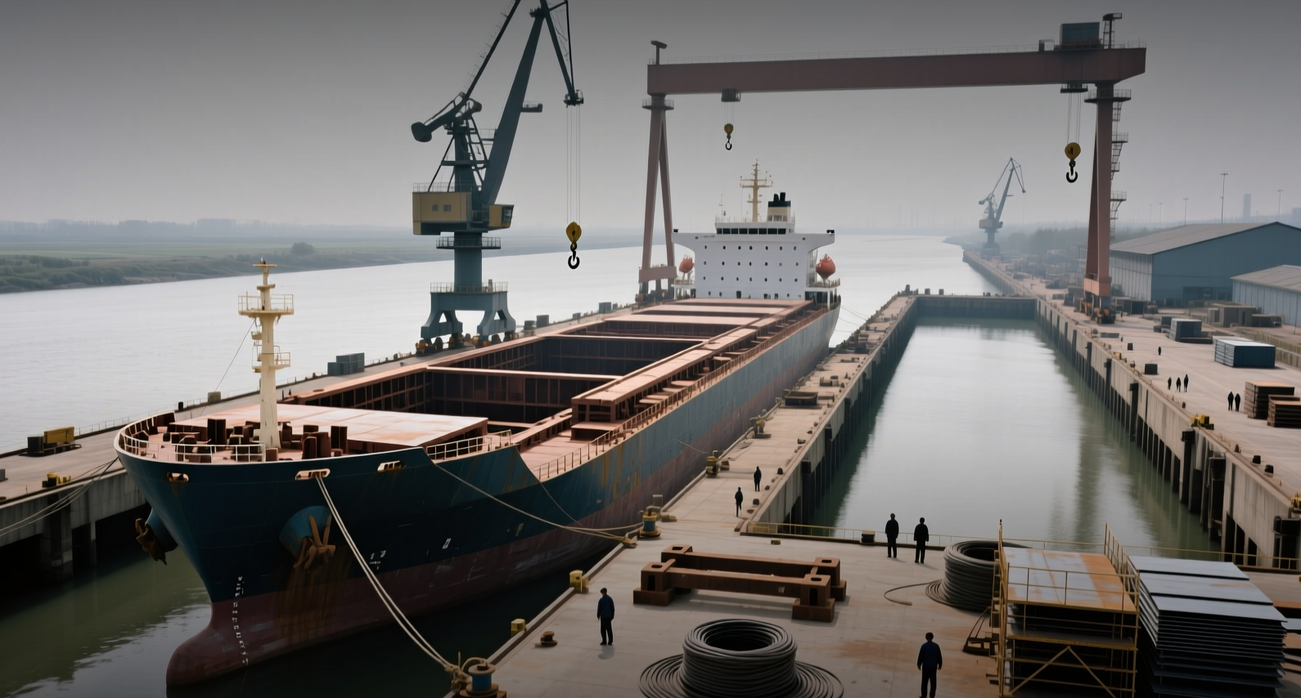
Distance, not the price of a barrel, is what shipowners are buying. More than $20 billion of new supertanker capacity has been committed this year as Gulf crude exports stall and Asian refiners reach across the Atlantic for replacement barrels, turning 20-day voyages into six-week ones — and the ships needed to sail them are running short. "The order book is a bet on distance, not on barrels," said Elena Fischer, a geopolitical risk analyst covering trade and sanctions. "When a cargo has to sail from Guyana to Ningbo instead of from Basrah to Ningbo, you need more ships to move the same volume of oil." The arithmetic behind that is ton-miles. A VLCC carries about 2 million barrels, and a Gulf-to-Asia run of roughly 20 days has been replaced in part by Atlantic-basin voyages that take 40 to 45 days. A vessel spending twice as long at sea is unavailable for a second cargo, which tightens the pool of ships open for charter even when the volume of oil traded is flat or falling. VLCC spot earnings have surpassed $500,000 a day, from about $132,000 in February, according to Reuters. That rate is the whole story. At $500,000 a day, a single 45-day voyage grosses roughly $22.5 million, enough to cover a meaningful share of a newbuild that lists at $120 million to $130 million. Owners holding yard slots at competitive prices can underwrite the order on two or three wartime voyages. ## The order book has already beaten 2008 The scale of the response has no recent precedent. Clarkson Research counted 262 new oil supertankers ordered globally, exceeding the previous peak set in October 2008, and Bloomberg reported in June that the total had passed that record. The 2026 tally of 217 VLCCs alone is roughly 2.3 times the full-year 2025 figure of 93. The 2008 comparison is the uncomfortable one. That ordering boom was followed by an oversupply of tonnage and a collapse in tanker rates that lasted years, because ships ordered at the top of a cycle arrive after the cycle has turned. Deliveries from the current wave are scheduled as far out as 2030, by which point the disruption may have ended and the routes may have normalised. Fleet age complicates the read. About 20% of the existing VLCC fleet is more than 20 years old, according to Reuters, and those vessels face higher maintenance costs, stricter inspection regimes and commercial penalties against modern, more fuel-efficient ships. Some of the 217 orders are replacement tonnage rather than growth, which would leave net capacity roughly flat. The distinction matters enormously: replacement demand is self-correcting, growth demand is not. Chinese yards are capturing the bulk of the work. A South China Morning Post report in 2026 said Chinese shipbuilders were securing more supertanker orders as the Iran conflict continued, giving yards production visibility into the late 2020s and a high-value workstream alongside container and gas carrier programmes. ## Asian refiners have already redrawn the map The rerouting is not hypothetical. Buyers have shifted supply lines away from the Middle East toward the Atlantic basin, including Brazil, Guyana and Argentina, Reuters reported. For Asian refiners, that means longer transit, higher delivered crude costs and a working-capital burden from cargoes that are at sea for six weeks instead of three. The physical disruption is severe. Commercial vessels transiting Hormuz fell to three on a single Wednesday, from 12 the previous day, according to preliminary ship-tracking data cited by Reuters. The International Energy Agency has warned that global oil supply in 2026 could fall by 5.7 million barrels a day because of Middle East conflict and Gulf disruption, while demand is also expected to decline — a combination that makes the durability of current freight strength genuinely uncertain. Middle East producers have responded by moving into ship ownership themselves, joining previously hesitant owners in buying tonnage. Controlling capacity gives exporters flexibility when charter rates spike or vessels are hard to secure, though it does nothing to remove exposure to attacks, insurance costs, sanctions or chokepoint delays. The transmission to consumers runs through delivered cost. Higher freight adds to the price Asian refiners pay per barrel, which feeds into fuel prices and import-cost inflation at a moment when the IEA expects supply and demand to fall together. For tanker operators, the near-term picture is strong: revenue visibility extends years out, and a fleet that is 20% past 20 years old guarantees replacement work regardless of how the conflict resolves. For shipyards, the backlog is locked in. The risk sits with the owners who ordered last. If Hormuz reopens and Atlantic-basin barrels lose their freight advantage, the market absorbs 217 new ships into routes that no longer need them — the same sequence that crushed rates after 2008. The next signal to watch is the pace of Hormuz transits: a sustained recovery above 10 vessels a day would mark the beginning of route normalisation, and the point at which the current order book stops looking like a hedge and starts looking like a glut. This article is for informational purposes only and does not constitute investment advice.

Sep 21 2026, 15:44
Europe's STOXX 600 climbs 1.07% as all three benchmarks top 1%
A broad advance swept across European equities on Sept. 21, lifting every major regional gauge by more than a percentage point and leaving the euro-area blue-chip index with the session's largest gain. The breadth of the move, rather than the size of any single index, is the signal traders are watching. The FTSE Eurofirst 300, which spans large-cap names across the region, rose 1.33% to 6319.74 — a gain that sits between the two other benchmarks and confirms the buying was not confined to one market or one index construction. "The synchronized close matters more than the headline number," said Priya Mehta, an equity market structure analyst covering index flows. "When the broad regional benchmark and the euro-area blue-chip gauge move together by more than a percentage point, it usually reflects index-level buying rather than a single sector's story." The three indices measure different things, which is why their agreement carries weight. The STOXX 600 tracks 600 large, mid and small-cap companies across 17 European countries and closed at 642.25, up 1.07%. The Eurozone STOXX 50 holds 50 blue-chip names from countries that use the euro and finished at 6320.63, up 1.35%. The FTSE Eurofirst 300 covers the 300 largest companies by market capitalization across the region. A session in which all three clear 1% indicates the buying reached both the euro-area core and the wider European market. Traders pointed to two candidate catalysts for the session. The first was a rally in technology shares, which carry heavy weight in the Eurozone STOXX 50 and helped pull that gauge to the largest gain of the three. The second was a retreat in oil prices, which eased pressure on energy-importing European economies and supported the cyclical names that dominate the broader indices. The gap between the Eurozone STOXX 50's 1.35% and the STOXX 600's 1.07% is the detail worth noting. The 28 basis points separating them suggest the euro-area blue-chip index, with its concentration in technology and large industrials, captured more of the session's upside than the wider market. The FTSE Eurofirst 300's 1.33% gain, just 2 basis points behind the Eurozone STOXX 50, shows the strength extended beyond the currency bloc. For investors holding European index exposure through ETFs tracking the STOXX 600 or the Eurozone STOXX 50, the session delivered a broad mark-up rather than a narrow one. The question now is whether the breadth persists. A single session of synchronized gains can reflect month-end or index-rebalancing flows that fade within days; a second and third consecutive session of all three benchmarks advancing would point to a genuine shift in regional allocation. The next test comes with the following session's open, when traders will watch whether the technology leadership that lifted the Eurozone STOXX 50 holds and whether oil's retreat continues to support the cyclical names in the wider indices. If both conditions persist, the breadth of this move would mark the start of a sustained pan-European advance rather than a one-day flow event. This article is for informational purposes only and does not constitute investment advice.