Edgen AI operates independently of, and is not controlled by Aspen Digital Financial Limited.
Bitcoin rises on cooler CPI as Fed rate hike odds collapse
 Edgen Crypto·Jul 17 2026, 09:57
Share to
Share to
Copy link

[1] The Latest Inflation Print Was Cooler. Does That Make Crypocurrencies a Buy? (https://www.fool.com/investing/2026/07/17/the ...)[2] CPI Shockingly Cool, Curbing Fed Rate-Hike Odds; Warsh Ahead (Live Coverage) - Investor's Business Daily (https://www.investors.com/news/cpi-inflation- ...)[3] US consumer inflation slows more than expected in June - Reuters (https://www.reuters.com/video/watch/idRW78891 ...)[4] Why Markets Are Declaring Victory On Inflation Too Soon Investorideas (https://menafn.com/1111408562/Why-Markets-Are ...)[5] Dollar hovers near one-month low as oil price risk lingers (https://www.cnbc.com/2026/07/16/dollar-near-o ...)
Related News
Sep 14 2026, 22:54
KULR dumps final 764 Bitcoin for $58.6M to end treasury bet
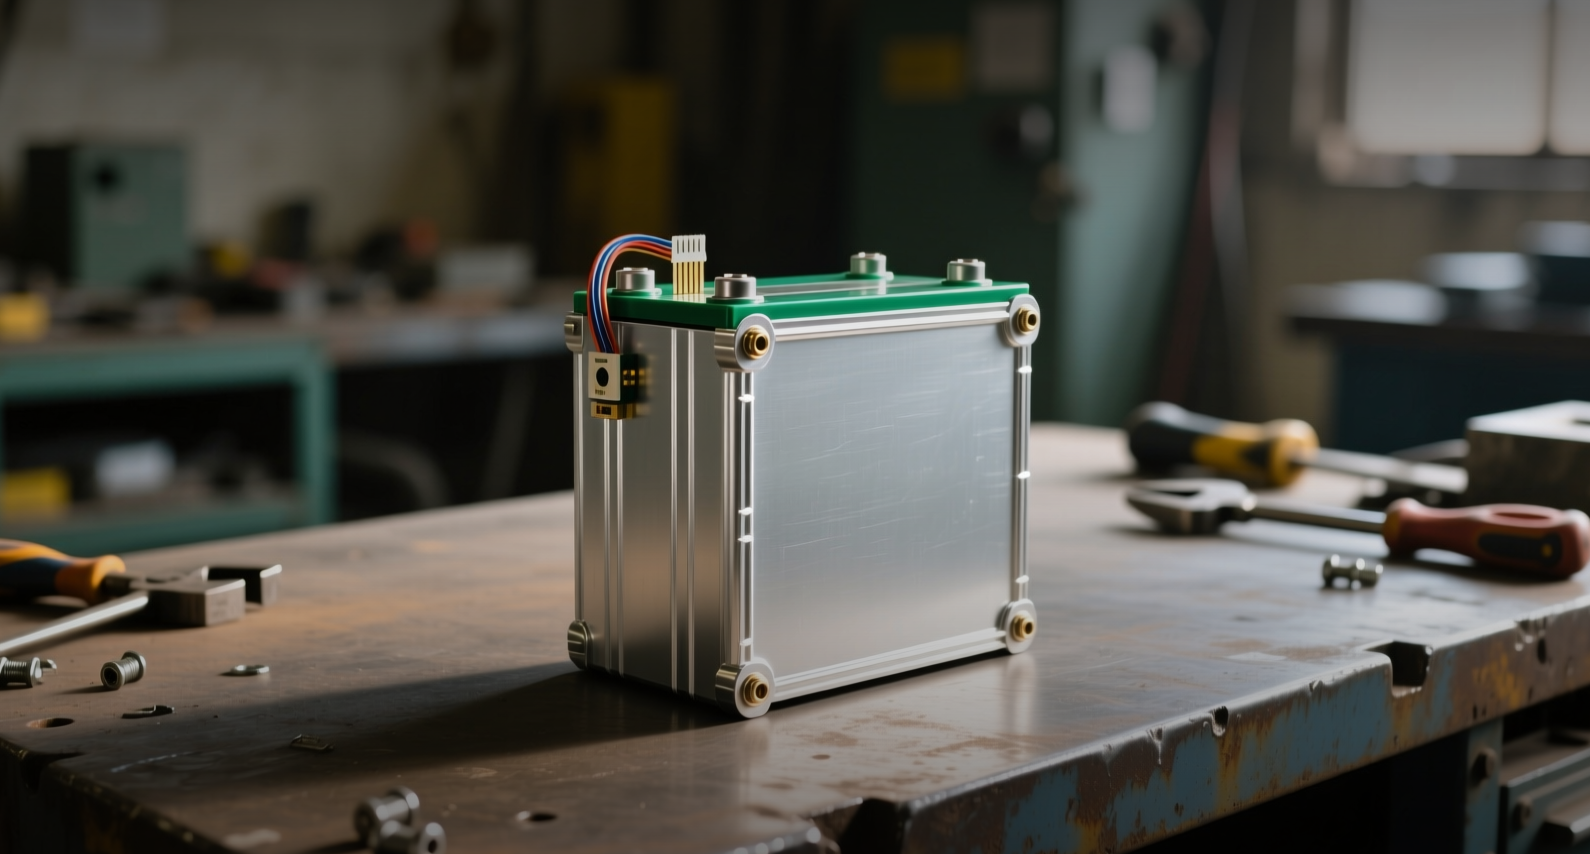
KULR Technology Group sold its last 764 Bitcoin for about $58.6 million, closing a two-year corporate treasury experiment and returning the battery maker to a balance sheet with no direct exposure to the cryptocurrency. The Webster, Texas-based company sold the coins in open-market transactions to unrelated buyers between Aug. 20 and Sept. 11 at a weighted average price of about $76,633 per Bitcoin, according to an 8-K filed with the Securities and Exchange Commission. The sales represented all of KULR's remaining holdings, and the company said it no longer holds BTC as of the filing date. The exit completes an unwind that began in July, when KULR sold roughly 333 Bitcoin for about $21.5 million at an average of $64,538 per coin. About $20 million of those proceeds went to repay a credit facility with Coinbase that had been collateralized against the company's Bitcoin. Combined, the two tranches generated about $80.1 million in gross proceeds from approximately 1,097 BTC. The second batch cleared at a price roughly 19% higher than the first. "The filing does not disclose the coins' cost basis or whether the final disposal produced a realized gain or loss," KULR said in the 8-K, which recorded the sale under Item 2.01, Completion of Acquisition or Disposition of Assets. The company described the sales as part of its ongoing treasury management operations and did not rule out rebuilding a position later. The proceeds arrive as KULR's core business is under strain. The company posted an adjusted loss of $0.47 per share in the second quarter of 2026, far wider than the $0.08 loss analysts expected, on revenue of $2.08 million against a forecast of $9 million, according to Investing.com. KULR shares traded at $2.38 on the filing date, down 47% over the prior year, with negative free cash flow of $46 million over the trailing twelve months. ## A 1,097 BTC unwind, in two tranches KULR began accumulating Bitcoin in late 2024, joining a wave of small-cap public companies that copied MicroStrategy's playbook of converting treasury cash into the cryptocurrency. It pushed holdings past 1,000 BTC through direct purchases and mining operations, layering a crypto revenue line onto its thermal management and battery safety business, which serves aerospace, defense and electric vehicle customers. The reversal became visible in August, when KULR disclosed it had sold roughly 333 Bitcoin after June 30. The company also shut down its Bitcoin mining operation as management redirected capital toward the energy platform. The Sept. 11 sale removed the remaining direct link between KULR's treasury and Bitcoin's price. For a company of KULR's size, the swings cut both ways. Bitcoin traded near $78,626 as of Sept. 14, up 2.45% over 24 hours and 24.63% over 30 days, according to CryptoSlate data — a rebound that came after KULR had already committed to selling. The company captured $76,633 on average across the final tranche, below the current spot level. The read-across matters more than the dollar figure. At roughly $58.6 million, the sale is a rounding error against Bitcoin's daily trading volume, but it is a data point in a broader reassessment by public companies that built crypto-heavy balance sheets during easier financing conditions. Several listed firms have revisited those positions as equity-market premiums to net asset value compressed and debt collateralized by Bitcoin came under pressure. ## What the cash buys, and what it does not KULR has not disclosed how it will deploy the proceeds. The filing leaves open whether management channels the funds into operations, debt reduction, acquisitions or other balance-sheet priorities — a gap that keeps the focus on whether the energy business can convert the liquidity into operating returns. Alongside the Bitcoin disclosure, KULR's compensation committee approved a grant of 200,000 time-based restricted stock units to Chief Financial Officer Michael Kimel under the 2025 Equity Incentive Plan, effective Sept. 10. Each unit represents a contingent right to one share of common stock, vesting in eight equal semi-annual installments over four years beginning Dec. 6, subject to continued service. The structural question for the corporate treasury cohort is whether KULR is an outlier or an early mover. Companies that funded Bitcoin purchases with debt face the same arithmetic KULR did: collateral values that move against the loan, equity premiums that can vanish, and core businesses that need capital. KULR's answer was to sell into strength on the second tranche and retire the liability on the first. Bitcoin's next test sits near $81,000, a level Coinbase CEO Brian Armstrong has flagged as the threshold before a move toward $400,000, according to CryptoSlate. Whether corporate supply stays a trickle or becomes a trend will show up in the 8-K filings of the next treasury holder that blinks. This article is for informational purposes only and does not constitute investment advice.
Sep 14 2026, 22:43
Bitcoin faces $82K or $76K test as Fed decides rate path
Bitcoin traded near $80,000 on Monday as leveraged positions piled up on both sides of the market, leaving the Federal Reserve's September rate decision to determine whether the token breaks through $82,000 or slides toward $76,000, according to a Bitfinex analysis published Sept. 14. Short exposure above $82,000 has climbed 43%, the exchange's research desk said, while long liquidation clusters sit at $75,000 to $76,000. The two boundaries bracket a market that has spent recent sessions pinned near $80,000, with neither side willing to commit ahead of the Fed's guidance on the path of borrowing costs. "Positioning this concentrated on both sides of spot means the Fed's forward guidance, not the decision itself, decides which cluster fires first," the Bitfinex note said, adding that thin spot selling could accelerate any move through the upper band. The asymmetry matters because the two clusters are not equally populated. A break above $82,000 would force short covering into a book with limited spot supply to absorb it, a combination that historically produces outsized single-session moves. A drop toward $75,000 to $76,000 would trigger long liquidations that add selling pressure to an already declining market, deepening the drawdown rather than cushioning it. Treasury yields and energy prices remain the secondary inputs. Higher yields raise the opportunity cost of holding non-yielding assets, and Bitcoin has tracked the 10-year Treasury note's direction closely through 2026. Energy costs feed directly into the inflation prints that shape the Fed's calculus, giving crude and natural gas an indirect but measurable influence on crypto risk appetite. Bitcoin's correlation with Ether and the broader altcoin complex means the outcome will not stay contained. A short squeeze above $82,000 would likely lift ETH and large-cap tokens harder than BTC itself, while a long cascade toward $76,000 would hit leveraged altcoin positions first, since those books carry thinner liquidity and wider liquidation bands. The Fed's decision lands with crypto market participants already cautious. Funding rates have flattened and spot volumes have thinned in the sessions leading into the meeting, a pattern that typically precedes a volatility expansion rather than a continuation of range-bound trading. Options markets have priced elevated implied moves around the event date. For traders, the practical read is that the $80,000 midpoint is not a level to defend but a fulcrum. Positioning data from Bitfinex suggests the market has already chosen its two outcomes and is waiting for the Fed to select one. Whichever cluster is triggered, the resulting move is likely to overshoot the boundary itself, because liquidation engines execute at market and the spot book on the other side is thin. This article is for informational purposes only and does not constitute investment advice.
Sep 14 2026, 22:41
Aptos caps APT supply at 2.1B as staking rewards halve
Aptos approved a tokenomics overhaul that caps APT at 2.1 billion tokens and cuts annual staking rewards to 2.6% from 5.19%, ending four years of uncapped issuance on the Layer-1 network. The change came through proposal AIP-140, which passed community governance and took effect with the network's circulating supply at roughly 1.196 billion APT, according to the Aptos Foundation. That leaves about 904 million APT of headroom before the ceiling binds, and lifting the cap would require a fresh governance vote — giving holders an effective veto over future dilution. "Burning every transaction fee while simultaneously capping supply is a structurally different bet than most L1s have made," said Jason Wu, an on-chain analyst who tracks validator economics across proof-of-stake networks. "The question is whether fee revenue scales fast enough to offset what validators lose on the reward cut." The reward reduction is the sharper edge for network participants. Annual staking rewards fell to 2.6% from 5.19%, roughly halving the yield paid to validators and their delegators. For an operator running infrastructure at a fixed cost, that is a direct hit to gross margin, and it lands at the same time as the network's second lever: gas fees rose tenfold, with 100% of collected fees permanently burned rather than routed to validators. The burn is the mechanism that ties the two halves together. Aptos had destroyed about 1.8 million APT cumulatively since mainnet launch in October 2022, as of mid-September 2026. The 10x fee increase is designed to accelerate that figure, and if usage holds, the network could reach the point where tokens destroyed through fees outpace tokens created through staking rewards — a net-deflationary state that Ethereum approached with EIP-1559 but never fully reached, because Ethereum still pays validators through block rewards and priority tips. Aptos burns the entire gas take. The Foundation added its own signal by permanently locking and staking 210 million APT, about 18% of circulating supply at the time, removing those tokens from liquid float indefinitely. The governance math is where the story turns forward. With 904 million APT of mintable headroom under the cap, any proposal to expand supply beyond 2.1 billion now needs explicit community approval — a structural change from the prior regime, where issuance was a protocol parameter rather than a holder decision. That shifts the bargaining position of large delegators, who lose yield under the new schedule but gain a blocking stake over dilution. For APT holders, the trade is straightforward on paper: less new supply competing with existing coins, plus a burn that removes supply outright. The offsetting risk sits on the demand side. Tenfold higher transaction costs raise the bar for on-chain activity, and if usage falls faster than the fee increase lifts per-transaction burns, the deflationary math weakens. Comparable L1s including Solana and Sui have kept fee schedules low to compete for activity, which makes Aptos' pricing power the variable to watch over the coming quarters. This article is for informational purposes only and does not constitute investment advice.